|
▪ |
|
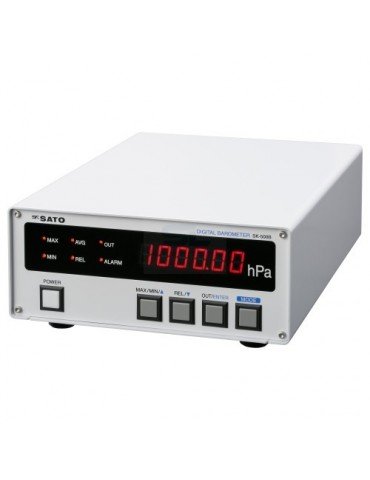
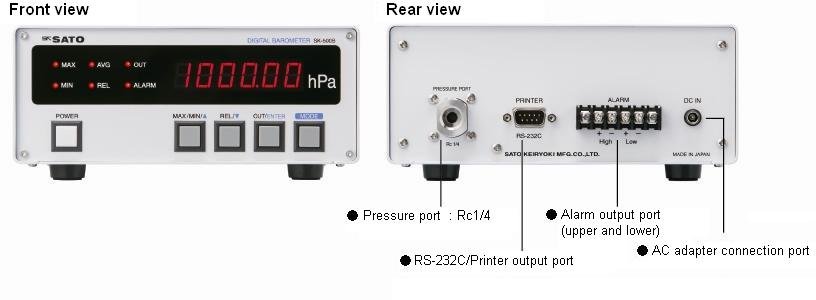
Wide measuring range of 600 to 1100hPa |
|
▪ |
|
High resolution of 0.01hPa |
|
▪ |
|
Red LED for easy visibility |
|
▪ |
|
Various arithmetic results: calculates and displays the values of MAX, MIN, AVG and REL |
|
▪ |
|
RS-232C/Printer output
Equipped with an RS-232C output. Measured values can be displayed on a computer in real time. The data also can be printed out in real time with the optional printer |
|
▪ |
|
Upper and lower limit alarms
Equipped with a contact output that can be connected to an external alarm device such as a buzzer and revolving light.
Upper and lower limit alarm values can be separately set |
|
▪ |
|
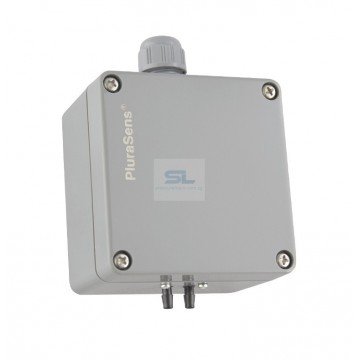
Pressure port that is the inlet for the atmospheric pressure is equipped |
|
|
| Measuring range |
600.00 to 1100.00hPa |
| Resolution |
0.01hPa |
Accuracy
(at 10 to 40C) |
±0.50hpa (700.00 to 1100.00hPa)
±1.00hpa (other than above) |
| Sampling time |
approx. 1 sec. |
| Sensing element |
Piezoresistance pressure sensor |
| Display |
7 segment red LED (6 digits) Status indication: red LED |
| Operation ambient |
-10°C to 50°C, less than 85 %rh (no condensing) |
| Power requirement |
9VDC (exclusive AC adapter in 100 to 240VAC use) 660mA 50/60Hz |
| Materials |
Main Body: SPCC
Display: acryl resin
Pressure port: SUS304 |
| Dimensions |
(W)200×(H)90×(D)280 mm |
| Weight |
appricx. 3.0 kg |
| Accessories |
Instruction manual, exclusive AC adapter x 1
RS-232C cable x 1
USB serial cable (with CD-ROM for USB driver) x 1 |
|
By using the exclusive software, measured data can be displayed on PC in real time.
▪ SK-500B and PC can be connected with the dedicated cable
▪ Measured data can be evaluated with graphs on PC
▪ Acquired data can be stored with "CSV" format in real time
▪ Exclusive software can be downloaded from our software downloading page
▪ OS:Windows XP(SP3), Windows 7(64-bit/32-bit), Windows 8(64-bit/32-bit), Windows 8.1(64-bit/32-bit), Windows 10(64-bit/32-bit)
Graph Display on the PC Screen

|
Atmospheric pressure is defined as “power” on the horizontal surface by weight of the air and hectopascal (hPa) is used
as a unit of atmospheric pressure.
The air becomes atmospheric layer and wraps up the earth. The weight (pressure) of approx. 1kg per 1cm2 applies to sea level
and it is equivalent to approx. 1,013 hPa.
As altitude rises, the air decreases and its weight decrease.This means that the atmospheric pressure falls down as altitude rises.
Upon reaching a height of 100m above sea level, the atmospheric pressure will drop approx. 12 hPa.
Thus, in order to compare the readings measured at different spots (heights), it is necessary to convert it into the same altitude
as mean sea level. The converted atmospheric pressure is called Sea level pressure.
|
| The relation between Altitude and Atmospheric Pressure |
Altitude
m |
Pressure
hPa |
Altitude
m |
Pressure
hPa |
Altitude
m |
Pressure
hPa |
Altitude
m |
Pressure
hPa |
0
100
200
300
400
500
600
700
800
900
1000 |
1013.2
1001.2
989.5
977.7
966.0
954.5
943.2
932.0
920.8
909.7
898.8 |
1100
1200
1300
1400
1500
1600
1700
1800
1900
2000 |
887.9
877.2
866.6
856.0
845.5
835.1
824.9
814.9
804.9
795.0 |
2100
2200
2300
2400
2500
2600
2700
2800
2900
3000 |
785.2
775.5
765.7
756.3
746.9
737.5
728.3
719.9
709.9
701.1 |
3200
3400
3600
3800
4000
4200
4400
4600 |
683.6
666.6
649.3
632.7
616.5
600.5
585.1
569.7 |

|


